Data‑Driven Rail Planning
We align timetable design with how the railway actually runs. By showing where plan and reality diverge and why, stakeholders adjust timetables with evidence and improve punctuality without adding infrastructure.
Real rail operations as they happen: actual train movements and their relationship to planning, throughput patterns, and where plans diverge from reality. A shared, data‑driven view makes bottlenecks, systemic constraints, and timetable sensitivities visible — so planners and operators can adjust with evidence and close the plan‑vs‑actual gap.
Situation

Rail operations involve many actors and constraints, with timetables planned well in advance and operations shaped by real‑world events. Data about movements, capacity, and disruptions exists across systems, but is rarely combined into a shared view.
Client
Trafikverket (Swedish Transport Administration) - Sweden's national transport administration responsible for railway infrastructure, planning, and operations.
Challenge
There was a growing need to close the gap between how the railway was planned to operate — and how it actually did. Despite extensive planning efforts, discrepancies between timetables and real‑world conditions made it difficult to ensure punctuality, coordinate effectively, and optimise capacity.
What we did
We built a data‑driven representation of real train movements based on historical operational data. This made it possible to see, with precision, where plans consistently broke down in practice. We enabled stakeholders across planning and operations to use this shared insight to evaluate and design timetables that better reflect real‑world conditions — without increasing infrastructure. We also established explicit feedback loops from real‑world operations back into the planning processes (tactical and operational), supported by mathematical models (e.g., dwell/throughput estimates, buffer‑time sensitivity, and pattern detection) that quantify where and how to adjust plans.
Metronom pilot implementation: Building on this foundation, we developed Metronom Rail — an innovative tool that uses operational data as the basis for planning. By understanding how plans work in reality, significant benefits and savings can be achieved. The pilot implementation with Trafikverket for train plan 2025 demonstrates how data-driven planning can improve punctuality and efficiency across the railway network.
Experimental traffic information development: We also explored additional benefits through Trafikverket's "Experimental development of traffic information" project, focusing on real-time traffic information capabilities and solutions to support traffic management, journey planning, and cross-modal travel information.
Results
- Surfaced hidden patterns and constraints that impact punctuality and performance
- Demonstrated how data‑driven planning can align strategy with operational reality and support smarter, system‑wide decisions
- Delivered a working product showing how collaborative planning benefits from a shared view of what’s actually happening
With this solution, you can see how actual train operations (historical outcomes) differ from the timetable — and compare plan versus reality across time and space. By analyzing variations and patterns in running times, you can identify how stable the system is — and where there are risks of disruptions.
A key insight is the difference between common causes and special causes:
Common causes are variations built into the system, such as poorly designed timetables, insufficient margins, or recurring capacity problems at the same location.
Special causes are deviations that don't belong to everyday operations — such as accidents, switch failures, or extreme weather.
External disruptions can always occur, but in many cases problems stem from the timetable itself being too far from reality — or certain trains not actually running according to the timetable in practice.
Patterns and types of behaviors
The solution can identify these types of patterns at very large scale, providing an overview that would otherwise be difficult to see:
- Trains with high variation in running time patterns – fluctuate significantly in travel time, often due to uncertain buffers or network sensitivity.
- Trains with low variation in running time patterns – stable and predictable.
- Trains that are often early – may indicate that the timetable is conservative or incorrectly designed.
- Trains that are often late – points to the timetable not matching reality.
- Locations with high variation – junction points where small disruptions create wide-spread effects.
- Locations with low variation – function as stable points in the network.
What can you find with these insights?
- Systematic errors in the timetable (common cause) – trains that in practice never run according to the timetable.
- Problem areas (special cause-sensitive) – sections where even small variations create chaos throughout the system.
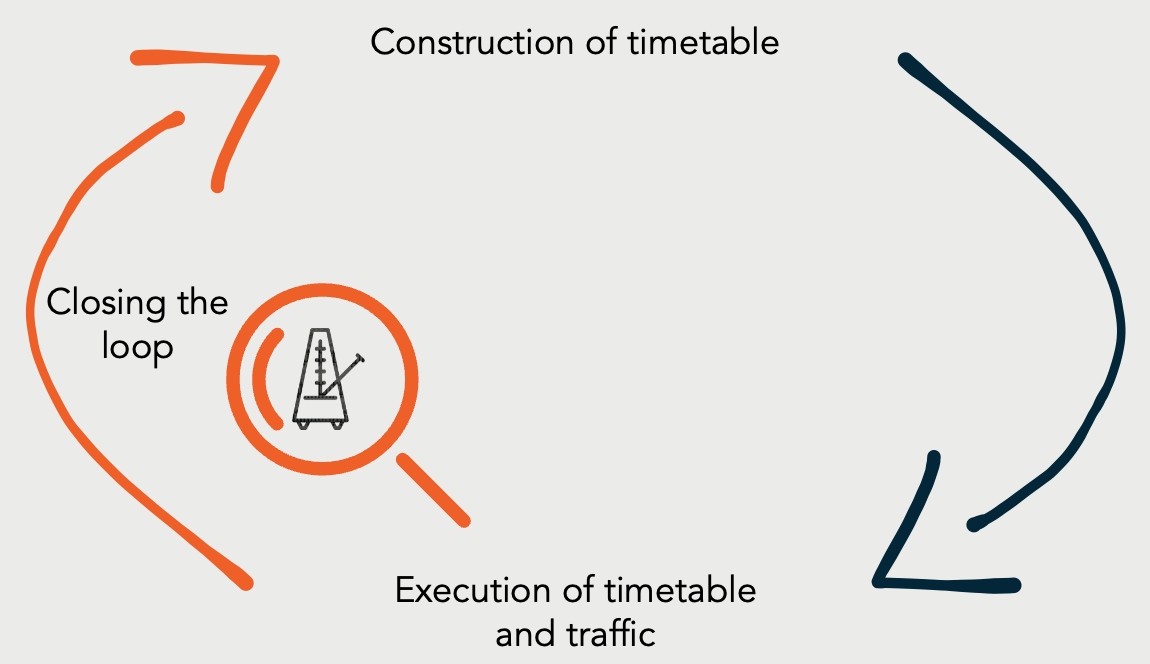
Closing the loop between timetable design and operations
Our solution explicitly closes the loop between constructing timetables and executing them in operations by establishing feedback mechanisms from real‑world performance back into design and adjustment.