Knowledge Graphs Explained
Knowledge graphs connect data and meaning so complex systems become legible. With shared semantics and identity, information lines up across silos and time — enabling better questions, reasoning, and action.
What is a graph?
At its core, a graph is a way to model the world as things and the relationships between them. In a graph, the things are called nodes (e.g., assets, locations, people, events) and the relationships are called edges (e.g., belongs‑to, depends‑on, causes, located‑at). This mirrors how we naturally think: not just about objects, but how they connect.
What is a knowledge graph?
A knowledge graph is a graph whose nodes and edges are described with shared meaning. That typically includes:
- Semantics: common definitions for entities and relationships so data from different sources lines up.
- Identity: stable identifiers so the same real‑world thing is recognized across systems.
- Context and time: attributes, provenance, and time to capture how things change.
- Reasoning: the ability to infer new facts from existing ones using rules or machine learning.
Knowledge graphs connect data and knowledge into a coherent whole — making it easier to understand, query, and act on complex systems.
Why graphs and knowledge graphs are useful
- End‑to‑end visibility: graphs connect silos so you can see the full picture across teams and systems.
- Causality and dependencies: relationships make causes, effects, and knock‑on impacts explicit.
- Flexible schema: models evolve without heavy migrations; you can add new node/edge types as you learn.
- Better questions: you can ask path, neighborhood, and impact questions (“what depends on X?”, “who is affected if Y fails?”).
- Reasoning and AI: graphs provide structure for retrieval‑augmented generation (RAG), agent planning, and rule‑based inference.
- Reusability: shared semantics allow data and logic to be reused across use cases.
Typical examples
- Linking assets → sensors → events → work orders to understand reliability and cost.
- Connecting product structure → process steps → quality outcomes to close feedback loops.
- Mapping organizations, roles, policies, and systems to identify governance gaps.
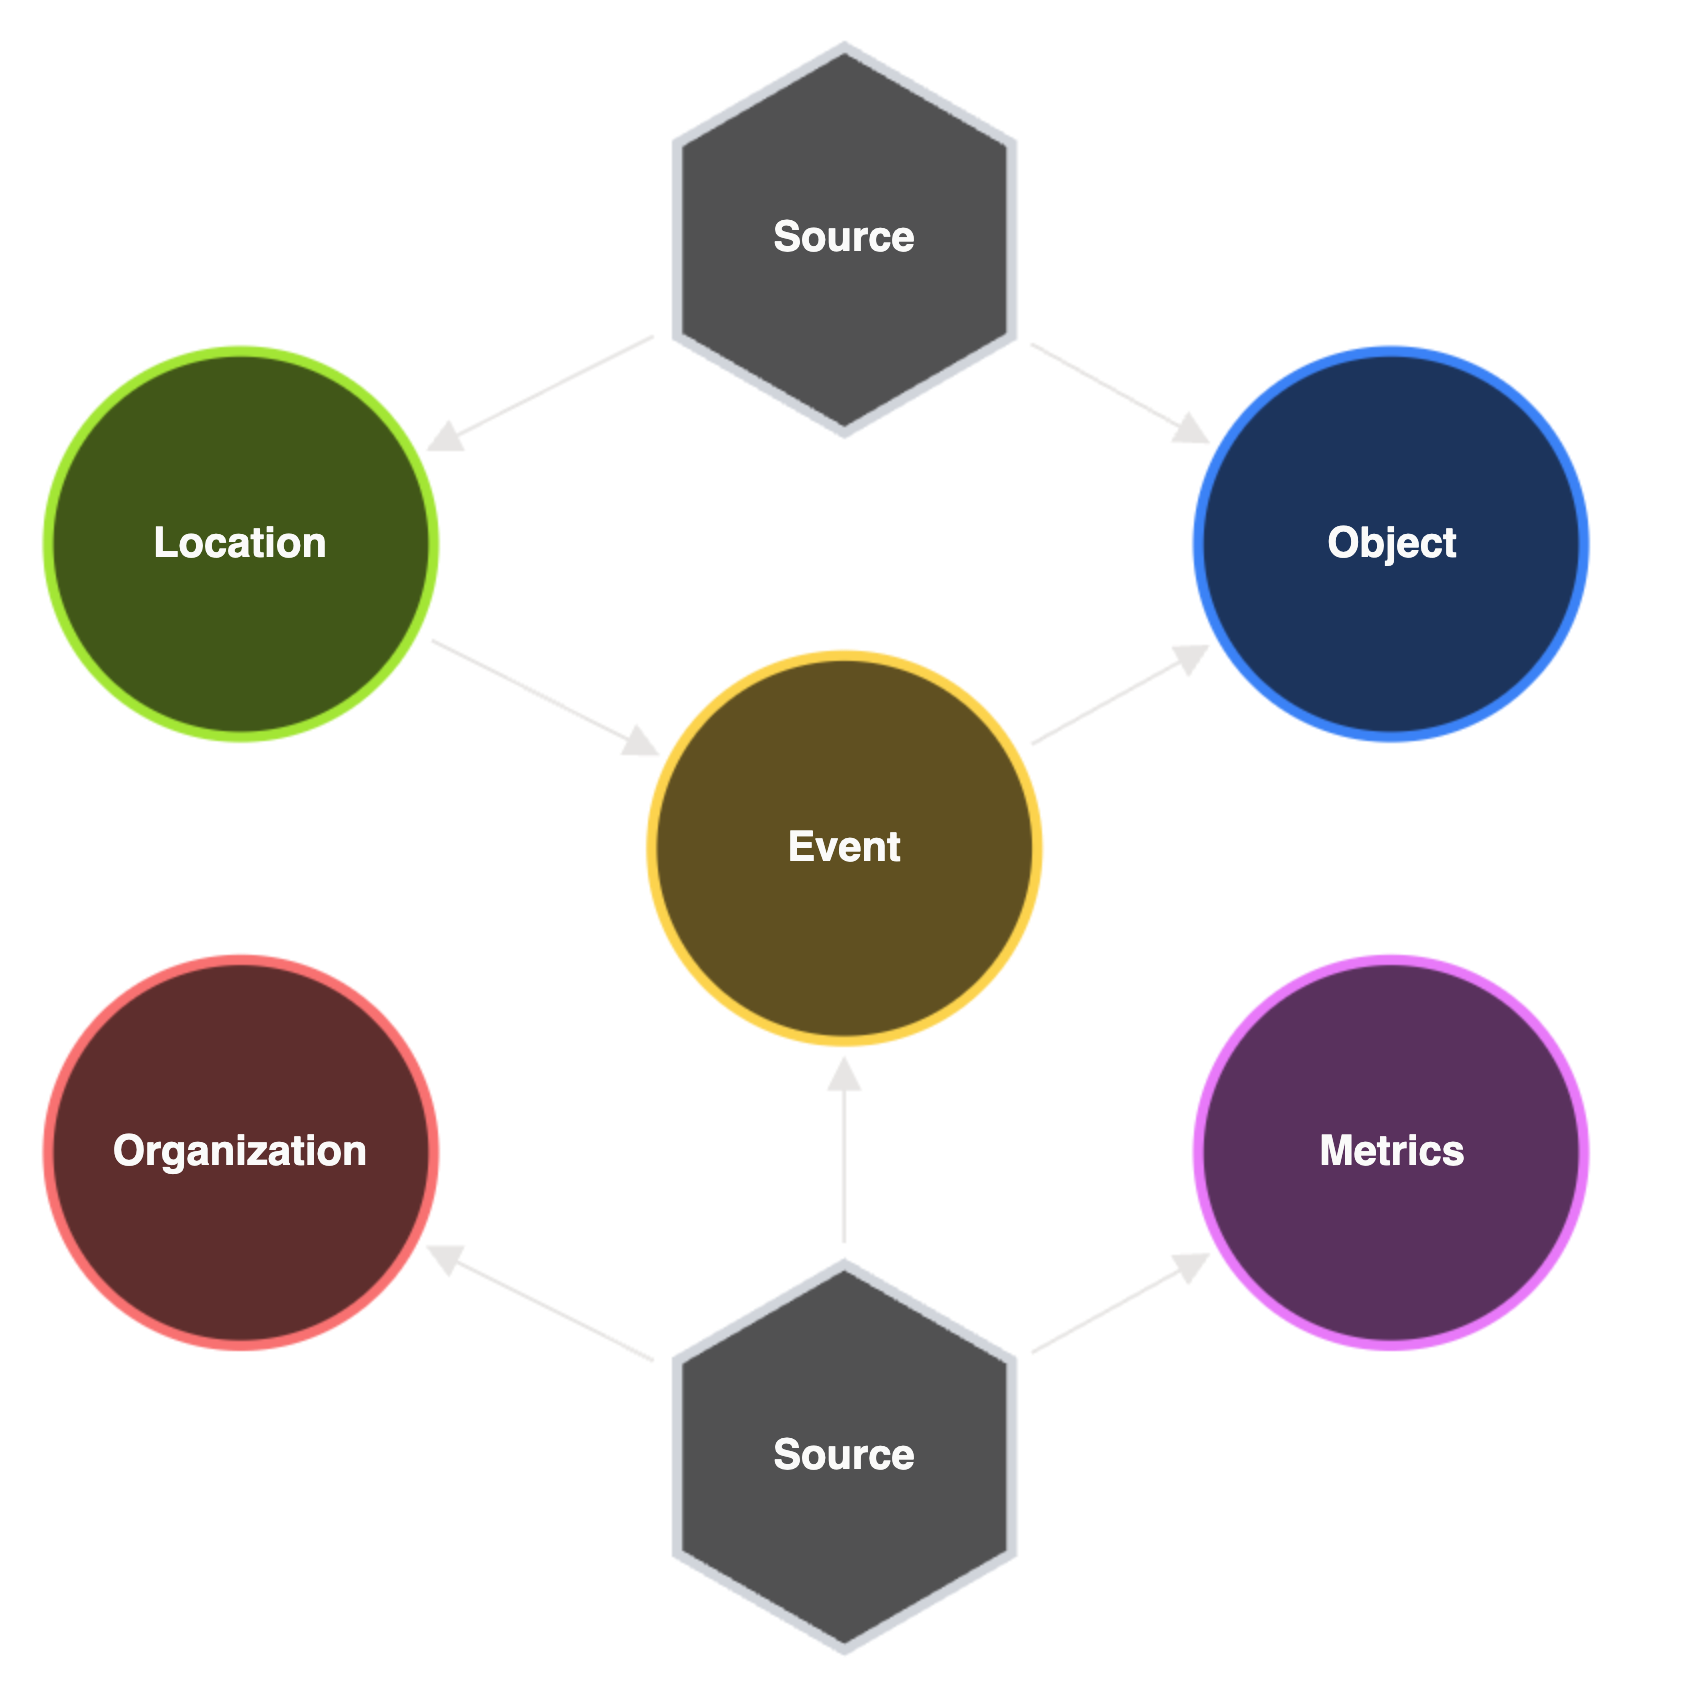
Example schema (Digital Tvilling Information Model)
The core entities often include Object, Event, Location, Organization, Metrics, and Source, with events linking real‑world changes to the surrounding context.
Simple example
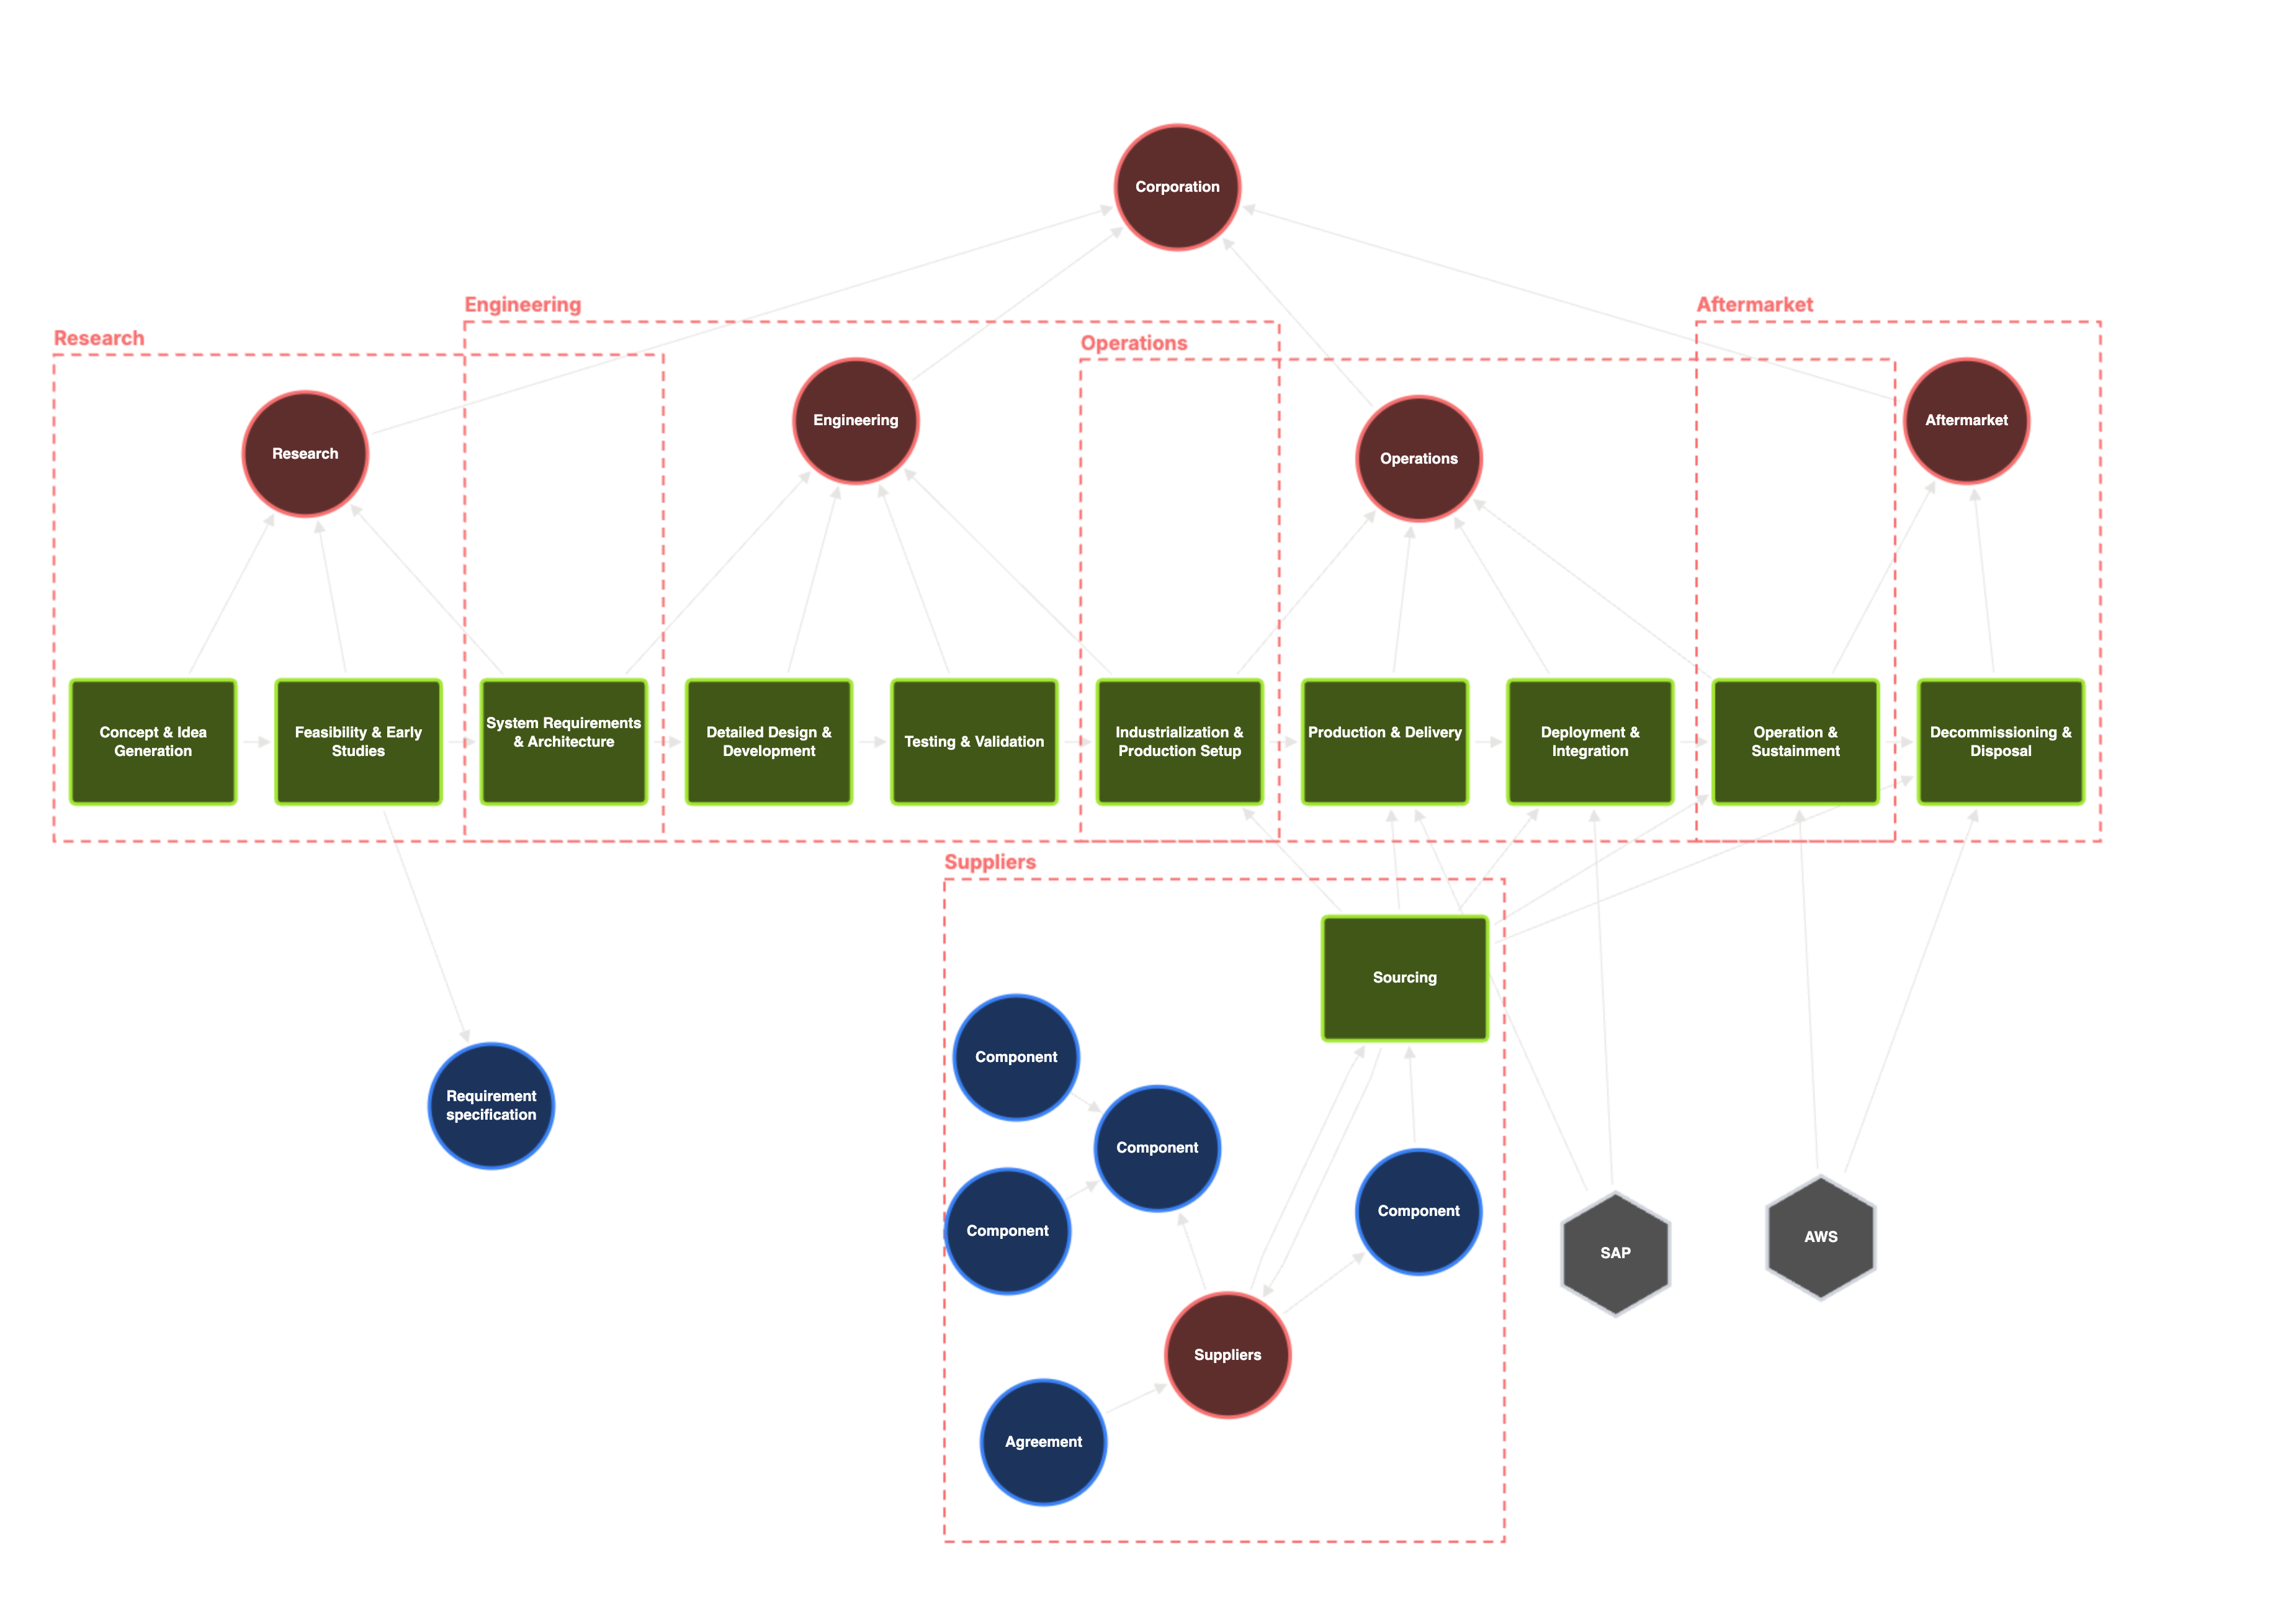
This simple knowledge graph shows a product/system lifecycle in its organisational context. Red nodes represent the corporation and four major functions (Research, Engineering, Operations, Aftermarket). Green boxes map the lifecycle stages from concept to decommissioning. Arrows indicate how information and responsibility flow between functions and stages over time. Suppliers and sourcing feed components and agreements into production and sustainment, while enterprise platforms (e.g., SAP, AWS) support sourcing, production, and operations. In short: it connects who does what, across which stages, and with which systems.
How this powers digital representations
Digital representations need connected, contextual data that reflects how the real world operates. Knowledge graphs provide that backbone: a living model that unifies structure, behavior, and history. On top of the graph, you can layer analytics, simulations, and AI agents that reason over the current state and likely futures.
Getting started
- Start from outcomes and questions you need to answer.
- Identify the core entities and relationships involved in those questions.
- Define shared names and identifiers; capture time and provenance where relevant.
- Load initial data flows; validate by answering real questions end‑to‑end.
- Iterate the model as new needs emerge.
Over time, the knowledge graph becomes a reusable asset: a shared language and living map of your domain that enables better decisions and faster change.